Preparation of Planning MRS
Load T1 MPRAGE Post Contrast images to 3D card for MPR process.
Select Parallel Ranges tool to produce SAGITTAL and CORONAL images.
Do not activate ‘Constant Number of Images’ button.
Adjust number of images to cover most of the anatomy structure (same as 2D scanning range).
Click start and save the images as SAGITTAL and CORONAL.
How to Get Image Thickness?
- Take the value from 2D scanning protocol. Usually 4mm.
How to Get Distance between Images?
- Take the value from 2D scanning imaging thickess + Gap value (hover the cursor to distance factor to pop-up the Gap value)
Selection of Voxel (ROI)
- svs_matrix (for single voxel spectro)*
- csi_slasser (for multi voxel spectro)
svs: Single Voxel Spectroscopy
csi: Chemical Shift Imaging
Single Voxel
Single Yellow box
Used for lession that near/closed to bony structure
ROI should cover atleast 75% of lesion area
Normal voxel size: 20 x 20 x 20 mm
(if we reduce the size about 0.5, SNR will be lost about 0.25)
svs_se: Spin echo or press (better signal and short scanning time)
svs_st: Stim
svs_se_30 / svs_se_135 / svs_se_270: The number is the TE value (low,mid, height)
Different metabolite will appear on different TE. However, 135 is the average TE that display most of the metabolites, especially the lipid and lactate.
Lipid will pointing UP, lactate will pointing DOWN in graph on 135 TE.
Multi Voxel
Have 2 types of boxes
- Yellow boxes: ROI (Region of Interest)
- White boxes: VOI (Volume of Interest)
Used for bigger lesion of wide space that not near to bony structure.
Normal voxel size: 10 x 10 x 10 mm
Advantage: can compare the lesion tissue with adjacent normal tissue.
The White boxes can be adjusted: ???
Scanning of MRS
Select the appropriate sequence (example: svs_se_135)
Load (drag and drop) T1 AXIAL Post Contrast, SAGITTAL and CORONAL images into EXAM card to plan the sequence.
Scroll AXIAL image until visualize the lesion.
Drag the voxel to cover the lesion on AXIAL image.
RIGHT-CLICK the AXIAL image –Copy Image Position
The SAGITTAL and CORONAL images will follow the center of lesion, based on AXIAL image.
Relocate again the voxel box to the lesion on AXIAL images.
Click SCROLL — NEAREST: to auto set the voxel box on SAGITTAL and CORONAL images.
The voxel box can be angulate to avoid bone or other structures.
Once confirm, click APPLY.
System start shimming process,
Confirm Frequency Adjustment window will pop-up.
- Graph must be slim and high peak.
- Single voxel: FWHM value below 15
- Multi voxel: FWHM value below 25
*FHWM: Full-Width Half Maximum
Click Continue.
System start scanning.
MRS Post Processing
Load the spectroscopy sequence images to Spectroscopy Application.
Graph of NAA, Cho and Cr ,and MPR images with the lesion will be loaded in the application.
- NAA: N-acetylaspartate (good guy) -NAA indicate the health of Myelin.
- Cho: Choline (bad guy)
- Cr: Creatine
- The image can be change to other images (ie: T1 MPRAGE Post Contrast)
- If the VOI is not at the lesion, an error message will pop-up (Spectroscopy Warning)
The MPR images can be adjust (windowing/zoom) to beautify the image display.
How to add Another Metabolite in the Graph?
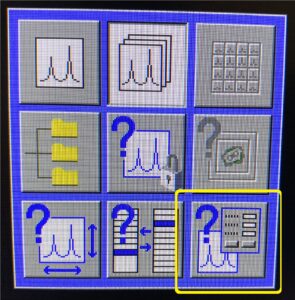
Option A
(Based on User History / Siemens Preset)
Click Protocols — Open.
Choose
- Customer (icon with C yellow box). – History user setup
- Siemens preset (icon with S blue box)
Choose the csi / svs with correct TE value based on protocol that being used. (ie: 135+lactate)
Click Open.
The Graph will update with the lactate peak shown.
Option B (Manual Add-on)
Click Interactive Post Processing button
Window Interactive Post Processing will pop-up
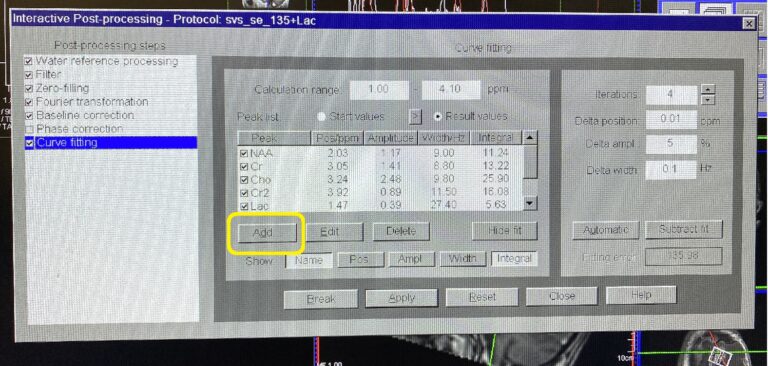
Click Add. Peak Editor window will pop-up.
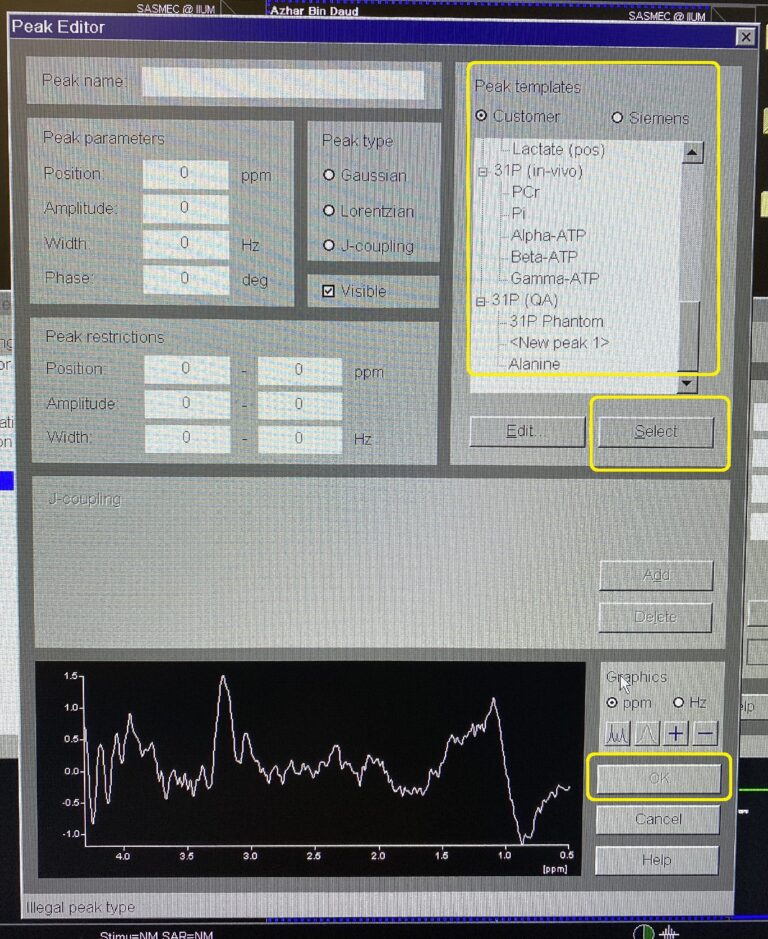
Highlight desire metabolite at Peak template. Click Select –> OK.
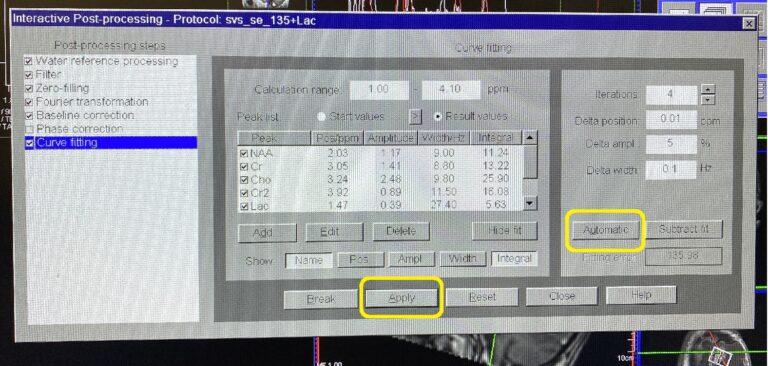
Click Automatic –> Apply.
NOTES
Lactate and Lipid signals are peaking at the same ppm (parts per million) at TE = 135.
Lipid resonates at 1.3 ppm chemical shift.
Lactate resonates at 1.33 ppm chemical shift.
To separate the peak signal of Lactate and Lipid in graph, change the Lipid phase to 180 degree. The Lactate phase is 0 degree. The Lipid graph will be displayed downward. The peak type for Lipid is Gaussian.
“Position: value in ppm (part per million) – to identify the locality of the metabolite”
White graph: Overal display of all metabolites
Red graph: Focused graph of the interest metabolite (curve fitting)
How to Save Metabolite Preset Setting
To save the metabolite preset setting
- Protocol –> Save As –>key in the name –> Save.
How to Generate Ratio Table Between Metabolites?
Right-click on the images box (blank)
Choose Result Table.
Tick the metabolites of interest.
Make sure to highlight (single click) the primary metabolite.
Click OK.
The table will appear.
How to Save the MRS Result?
Click the Spectrum (Graph) to activate the image.
Click Patient — Save Data
Choose Select result (ie: spectrum)
Click OK
Repeat the same step for the Ratio table
All the saved images (RAW, Spectrum and Ratio Table) will be located under same protocol file
How to Save Image in RGB?
Open Patient Browser
Select the saved MRS result data (contain the result images)
Select spectrum and ratio table images
Click Application — DICOM Tools — Save as RGB